Anyway the topic is one that has occupied Britain for decades, and will continue to do so far into the future...
It is ......... housing ....... and rather than wallow in my moving stasis I thought I'd take the long view on the overall situation in the country with a historic lens...
The post will not split down on regionalism, instead looking at the whole of the UK. London property in particular has grown more than regional property - and I believe property in the south of England has gone up rather more than the north.
These might be explored further in later blogs - and of course everyone's individual mileage varies - for now this one looks at overall averages across the whole of the UK.
First up lets have a look at the headline picture - house price growth since 1971: (Source ONS)
The 'crash' of the early 90s is in there (Though it was more of a flatlining in the round), and the 2007 correction. We can also clearly see the mid 90s -> mid 2000s at least tripling of prices.
Of course wages have also increased from 1971 to now. Here is a plot of the average wage (I'm ignoring skew for the sake of simplicity) added to the house price graph. The source is: https://measuringworth.com/ukearncpi/ ,and both lines have been rebased to the same point.
The local maxima are December 1973, July 1989, September 2007.
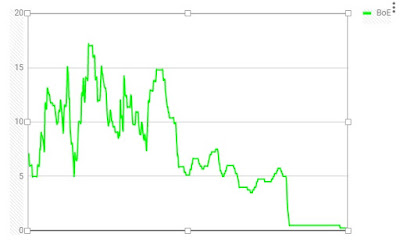
But of course there is an additional factor, the bank of England base rate - ostensibly used as a tool to control inflation - here is how that has gone from 1971 to present (The latest 0.25% increase isn't shown as the data only goes to September of this year):
From this the I'm going to derive a slightly contrived function - the average mortgage repayment (As a % of salary). The terms of the mortgage are 25 years, at the BoE base rate + 2% (This reflects that some people will be on offers, and others on bank SVR; and that the banks generally look to make a profit on mortgages !). The mortgage will repay 100% of the capital borrowed, and the mortgage is assumed to be 100% of the property value:
Anyway here goes:
The local mortgage maxima are November 1973, November 1979, the third quarter of 1989 and August to November of 2007.
Conclusion
Purchasing a property financially is a game of two halves: The deposit and the mortgage repayments.
Right now the deposit required for a property is historically unaffordable, but if ALL the capital could be borrowed then the mortgage repayments are historically somewhere near the global minimum due to the extremely low interest rate currently at the Bank of England.
Looking forward:
Dwelling growth continues to be outstripped by population growth1, hence the general upward trend in wage-house price ratio. Also seeing as people only need one property, the value of one's property doesn't particularly matter providing people can service the mortgage as superior properties will generally cost more, and inferior ones less.
It is also the one general purchase in life where credit almost always makes sense seeing as a use is received from housing over a lifetime, whereas the price is only paid once. This blog post doesn't have the scope to get into Buy to Let arguments beyond noting purchase of property beyond a first is to a large degree speculation.
What should be done:
The historically high house price/wage ratio makes it more difficult than at any time previously to purchase a property, though once purchased the mortgage repayments are not historically onerous. Policies such as help to buy are basically sticking plasters (And could inflate the market yet further as well as exposing the Gov't to house price risk)
A program that encourages housebuilding either directly or indirectly, and a (very) slow rising of interest rates would seem the best way out of this to me so as not to cripple the market but also return long term affordability.
1http://www.telegraph.co.uk/finance/economics/11113110/Three-reasons-why-Britains-housing-market-is-broken.html (Which has some interesting charts - chart 1 is the one to look at though) & https://en.wikipedia.org/wiki/Modern_immigration_to_the_United_Kingdom#/media/File:UK_Migration_from_1970.svg which shows immigration (I understand it doesn't show population growth but that is very highly correlated)


